Dear Trader,
Beware of market mythology! Traders are a strange lot indeed. They’re prone to believe all sorts of nonsense. They take refuge in myth and magic. They believe in indicators that have sex appeal but no substance in reality. Traders are a nervous lot indeed. They tend to be wildly bullish at market tops and exceptionally negative in market bottoms. In order to harness the contrary nature of small traders, various and sundry methods have evolved over the years. These include the contrary opinion theory, the use of odd lot short sales, The Daily Sentiment Index, and various other measures like small trader sentiment. The good news is that we know small traders are usually wrong at major turning points.
The bad news is that most people have no idea how to use this information in order to capture profitable trading opportunities.
5 Ways to Pinpoint Market Turns with Sentiment
At my new webinar I will teach you five ways to pinpoint important market turns in different time frames using contrary opinion and market sentiment. You will learn why, when, and how to use market sentiment effectively. Many of the clients who use my market sentiment indicator are among the largest, most well-known and most successful hedge funds, financial firms, and speculators. You will see why!
Market Sentiment and Bottoms
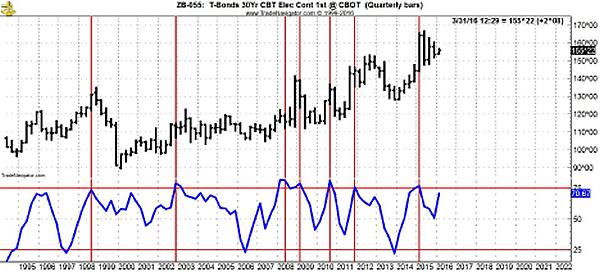
If we plotted raw market sentiment against price, our chart would look wild and crazy because frequently small trader sentiment is extremely volatile. The reading from exceptionally negative to exceptionally positive is a very short period of time. However, my modification of raw sentiment yields extremely interesting and potentially profitable results. As an example, consider the chart of Treasury Bond futures shown below. At the top of the chart I have plotted the monthly price ranges. At the bottom of the chart you see the modified market sentiment indicator. Let’s look only at major market bottoms! Take a few minutes to examine the chart. Notice how well sentiment at the extreme lows is correlated with major bottoms, or has preceded major bottoms. If you combine this valuable indicator with timing, then you have solved a major issue in trading, and you have found an extremely valuable resource. As you will see later at my webinar, my modified sentiment indicator can also be used for intermediate and short-term price swings.
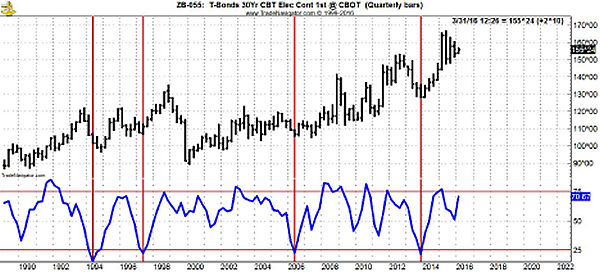 |
Now let’s take a look at the same indicator and its behavior at market tops.
Since 1996 there have been six significant tops in 30-year Treasury Bond futures. My DSI indicator has either pinpointed or preceded every one of these tops!
Who uses the DSI?
If you saw the list of DSI subscribers, you will see that it reads like a who’s who of top names in the financial arena. Some of the world’s largest and most well-known hedge funds, banks, traders, and advisory services get my DSI figures every day in order to make informed and timely trading decisions based on the power of contrary opinion and market sentiment.
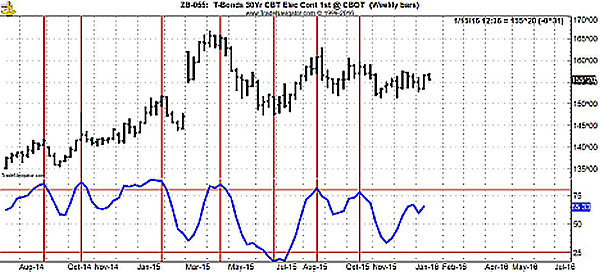
Weekly Application of Market Sentiment
If you think that contrary opinion and daily sentiment are effective only in the long-term time frame, then it’s time to rethink your thinking. Shown below is the weekly Treasury T-Bond futures chart with my DSI indicator at the bottom of the chart. Take a close look. Look at the amazing ability and correlation of daily sentiment as a leading indicator and concurrent indicator of market tops and bottoms.
No, it’s not perfect, but it’s one heck of a lot better than most of the worthless stuff that traders are using these days to pinpoint significant market turns.
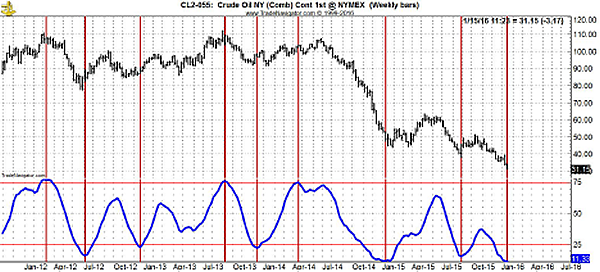
Let’s take a look at Crude Oil Futures With DSI
Clearly, the correlation between DSI and significant tops and bottoms in crude oil futures is phenomenal. No, it won’t pick all the tops and bottoms but it does have the most remarkable ability to precede many tops and bottoms or to correlate highly with them.
But here’s the most important thing!
Because the Daily Sentiment Index is an indicator and not a trading system, you must know how and when to use it. The combination of daily sentiment and timing is critical to success. To put it simply, you need to use the right timing triggers with sentiment in order to make it work properly. I will show you five ways in which to use the DSI with timing in order to vastly improve your timing and performance.
Let’s take a look at another market
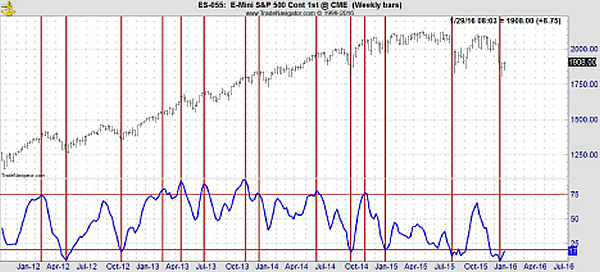
Of course, everyone wants to know about S&P futures. So let’s take a look at the weekly S&P chart with the market sentiment indicator. In so doing please note this is not the raw sentiment data which we release daily, it is a second order and third order derivation of the data which I will show you how to do at my webinar. Take a look at the chart below and decide for yourself. I love what I see; what do you think?
It’s Not a One Trick Pony!
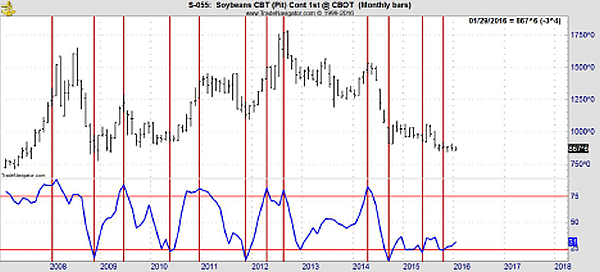
The DSI is versatile. Why? Because trader emotion reigns supreme in all markets. DSI is very effective in every futures market and while some are better than others, DSI is useful as a leading indicator in a vast majority of cases.
Shown below is a chart of quarterly soybean futures with my DSI indicator. Do me (and yourself) a favor, don’t just look at this chart; study it!
|