
|
Can you know your odds of success Now Available… NEW 2013 eBook* Jake Bernstein’s |
Early Bird Discount eBook format: Discount Price $129 Save $60 Offer expires 20 JUNE 2013 Click here to order |
|
To order Email delivery within 48 hours. |
| If you would like to use your 2Fer Cash Card for this purchase, Click Here to Order |
|
|
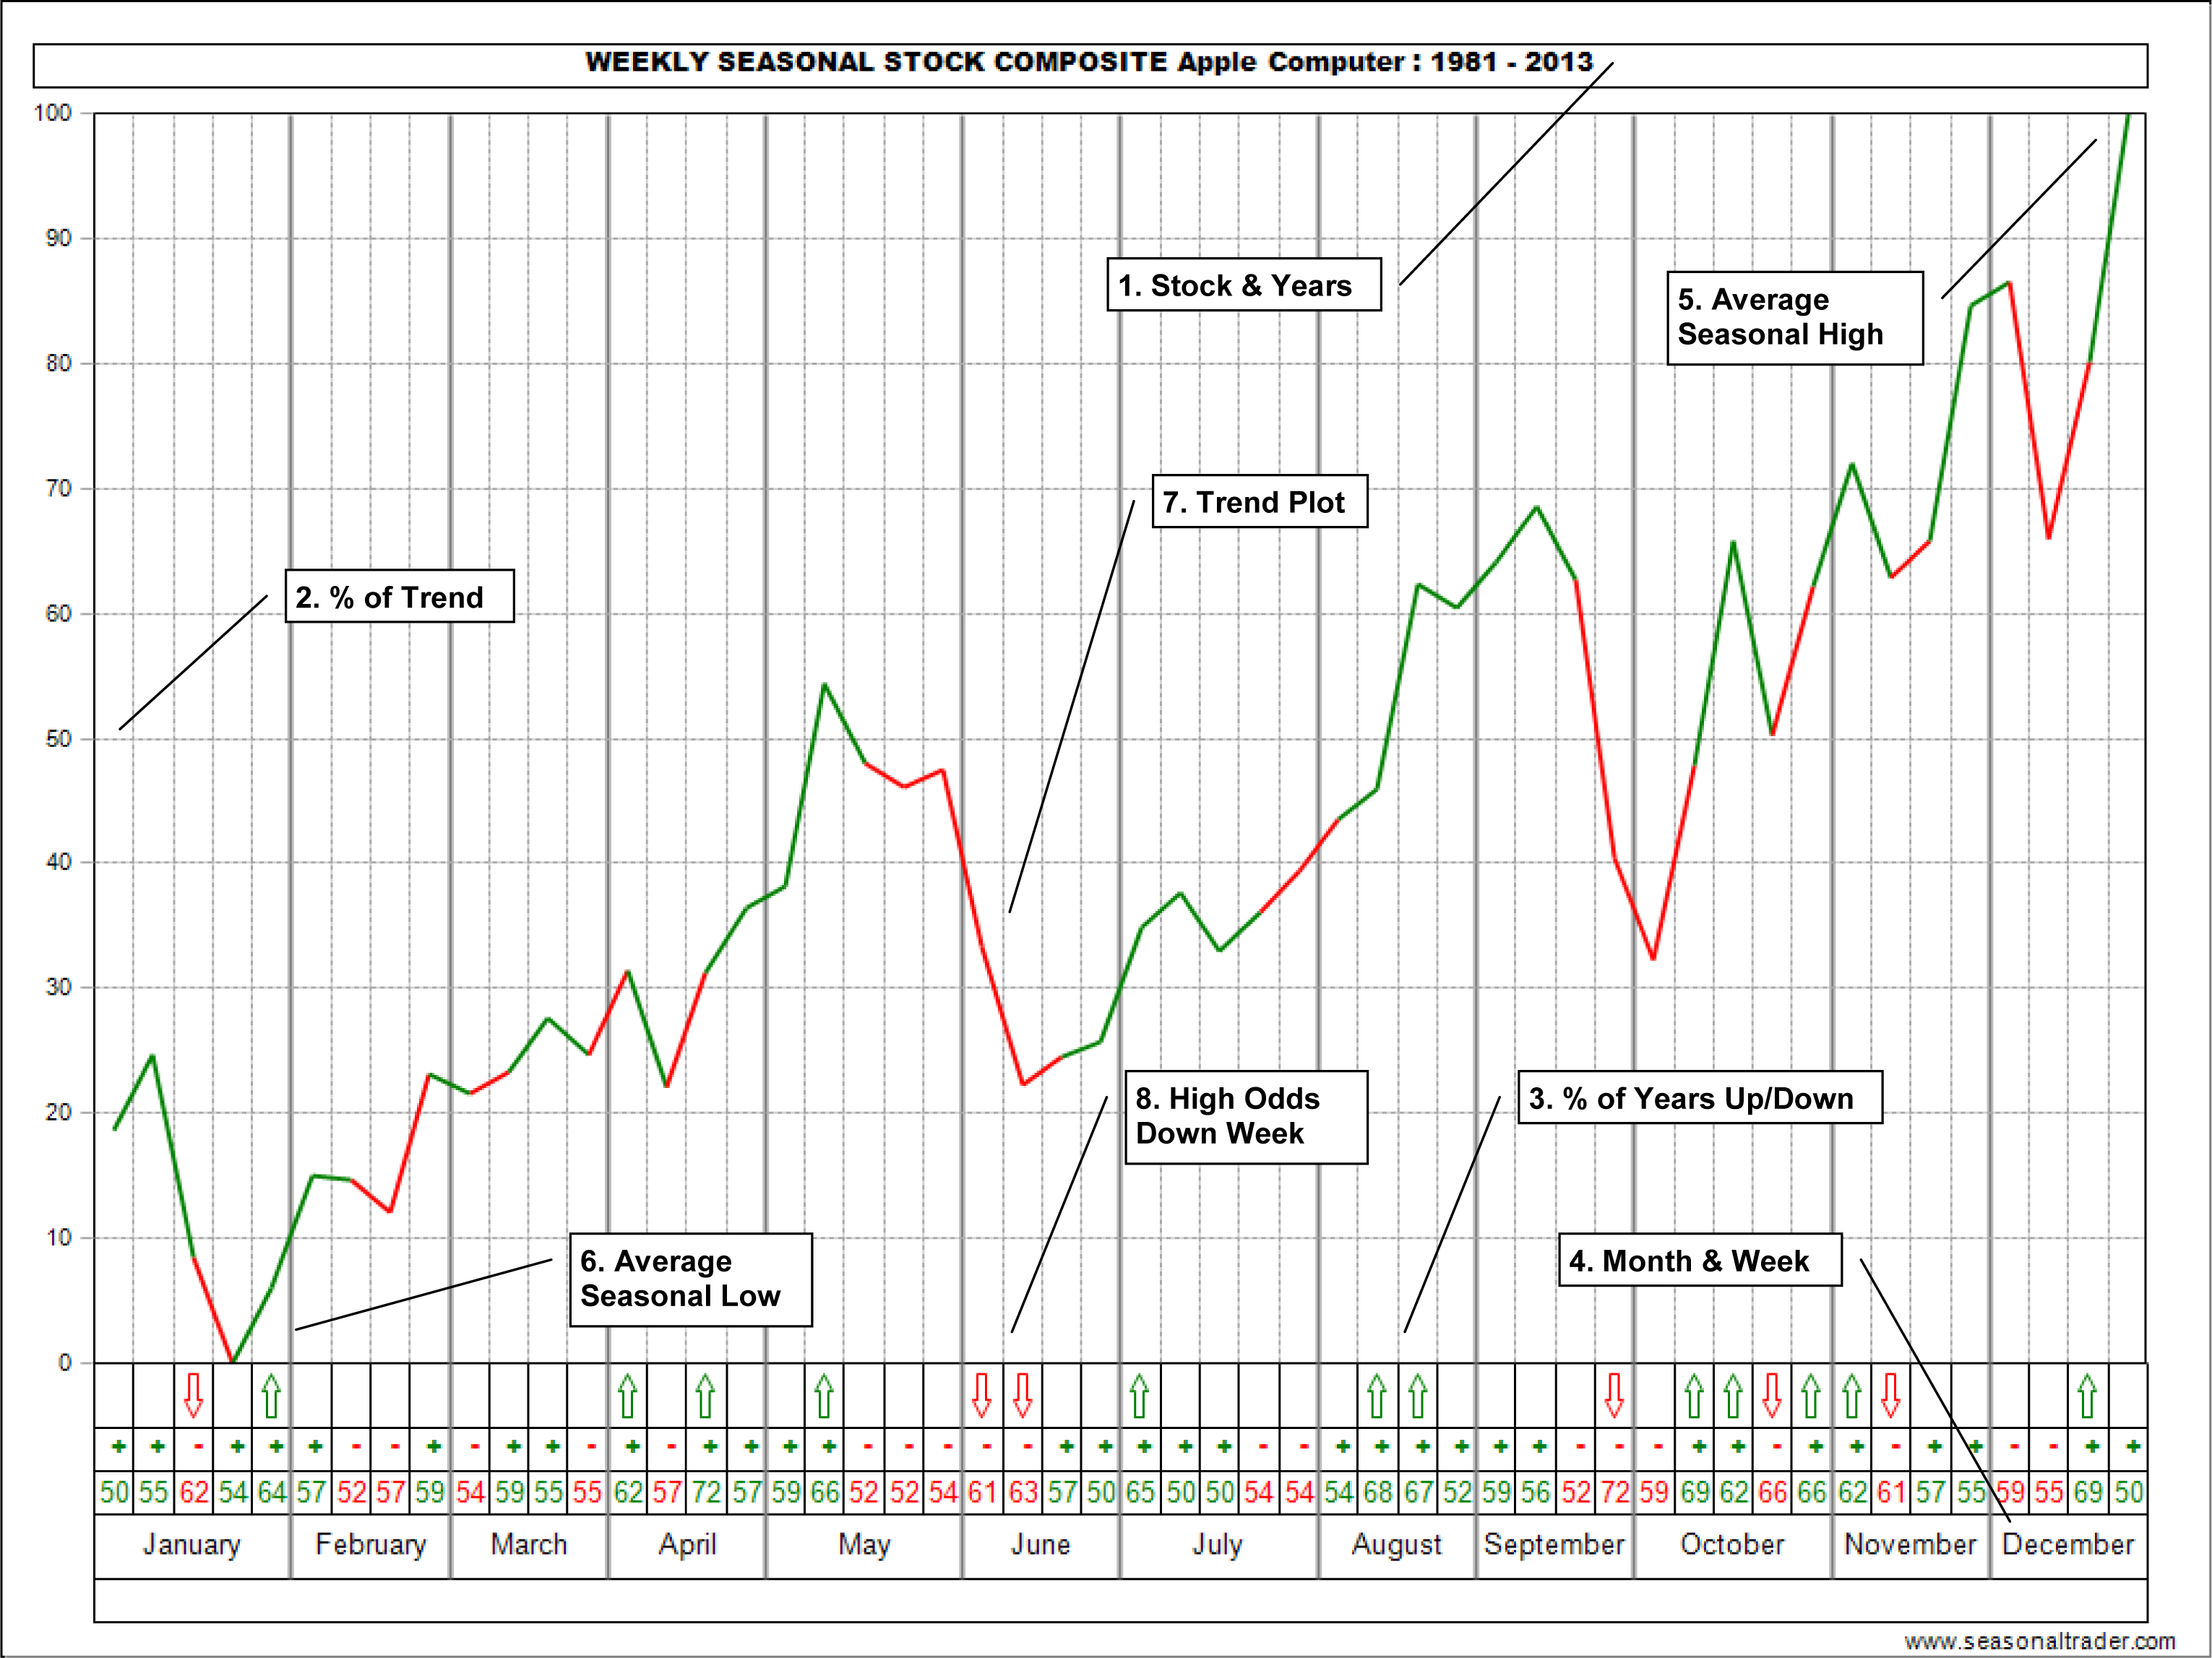
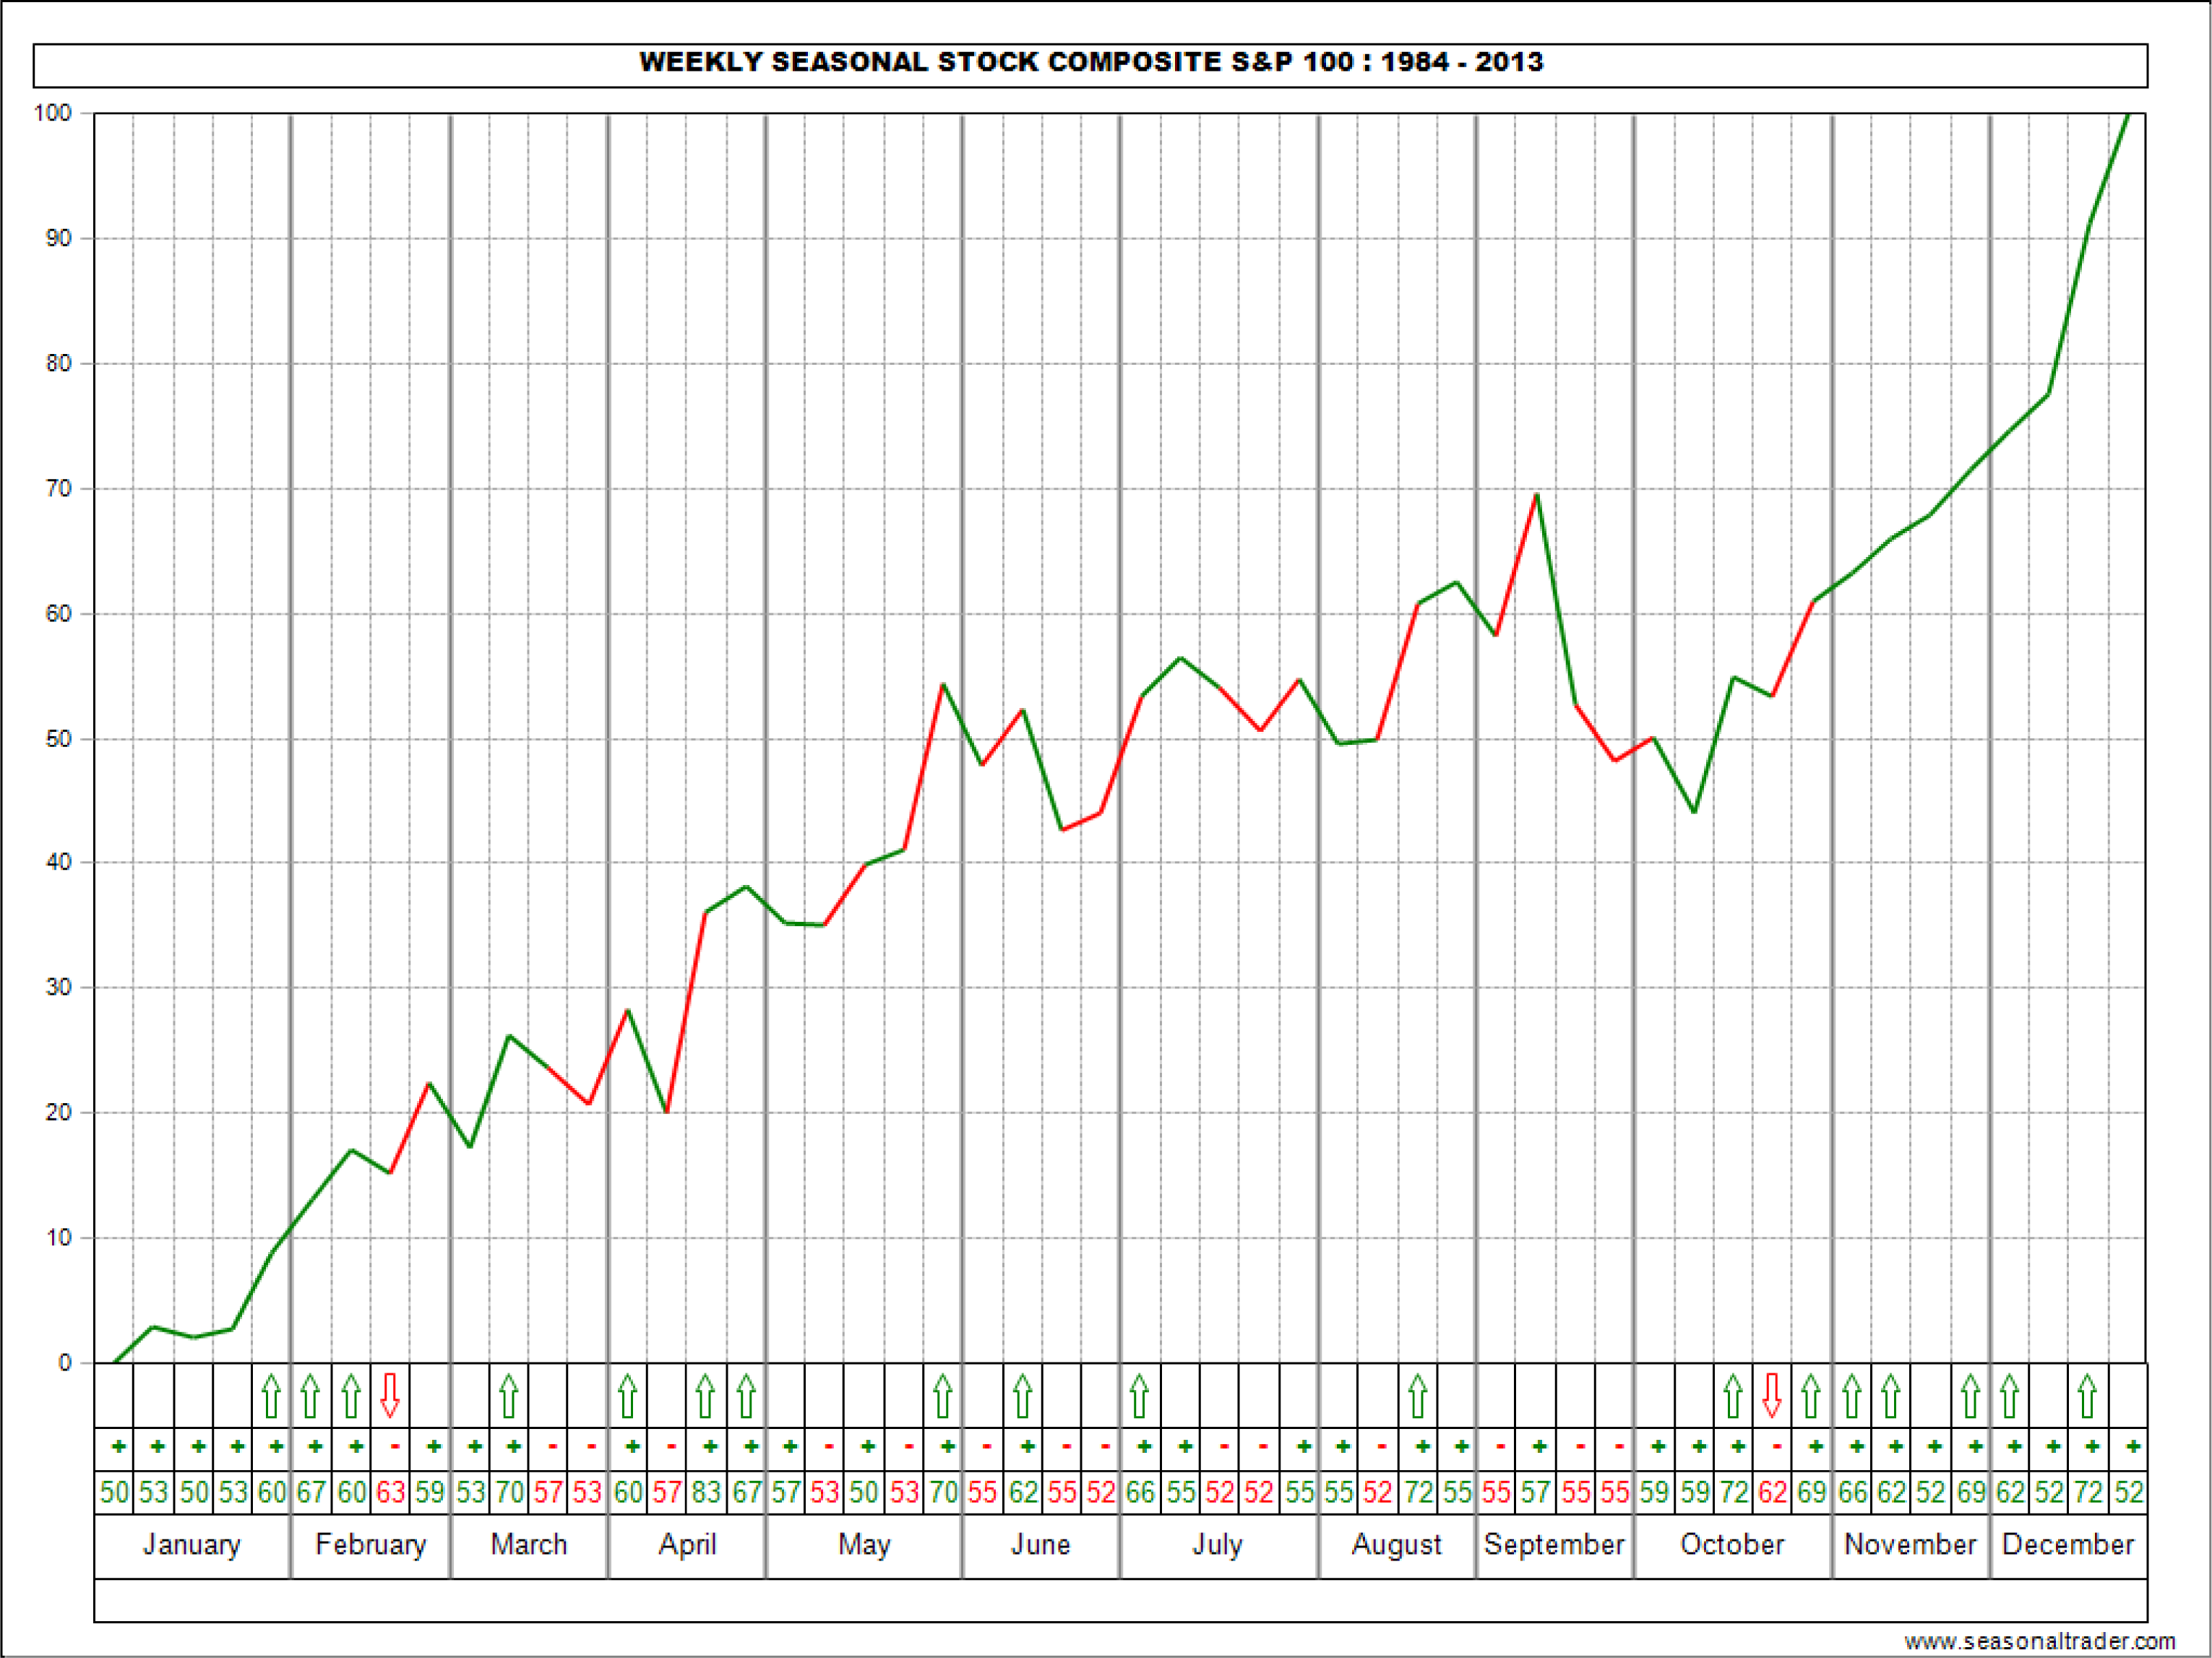
Weekly Seasonal Stock Charts | 2013 Edition THERE IS A RISK OF LOSS IN FUTURES TRADING |
|
|
Network Press
| 831-430-0600 | 800-678-5253