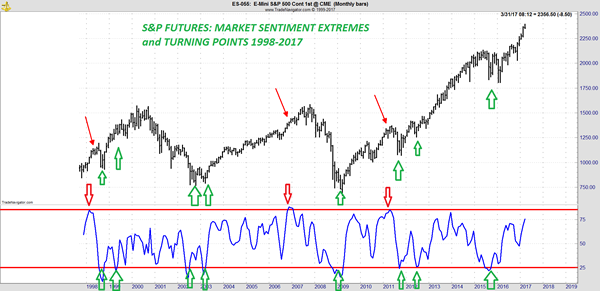
Take a few minutes to examine the chart above
What you see at the top of the chart is the price of S&P futures. What you see at the bottom of the chart is an indicator that has correctly predicted most major turns since 1998. No, the indicator is not stochastics, it's not ADX, it's not momentum, it's not DMI, and it's not MACD. In fact, it's not directly related to price whatsoever. Rather, it's related to trader perception of prices, or in other words, their emotional interpretation of where they believe prices are going as well as the bullish or bearish status of a move.
The line at the bottom of the chart represents trader opinion or sentiment.
A Brief History of Market Sentiment
For many years traders believed that majority expectations were most often wrong. Namely, we were told that if you could assess the expectations of the majority, you would do well to expect and do the opposite. Popularized by Charles MacKay's Extraordinary Popular Delusions and the Madness of Crowds, traders and investors assumed that major market tops were characterized by excessive optimism, soaring prices, and panic buying. We also assumed that major price lows were often correlated with and characterized by panic selling, plunging prices, and severe pessimism. For the most part these long-held beliefs were true. They did not, however, address the critical issue of timing.
• When in the midst of a selling panic, do we buy?
Too soon can lead to ruin. Too late could mean a missed major opportunity.
• When do we sell into a buying panic? Too soon means less profit.
Too late could mean missing an optimum exit and/or short sale.
• How do we quantify panic tops and bottoms?
Are there objective tools or indicators?
• How can we collect data to objectively measure these emotionally charged periods?
• Is there a process we can use for the above to ensure consistency? |
In the 1970s James Sibbet and Earle Hadady published a weekly market sentiment service which provided a % bullish reading in major futures markets based on their survey of futures brokers. Although Sibbet and Hadady intended to bring clarity to the issues of using market sentiment, their work led to more questions than answers.
Here are some of the issues:
• Why survey brokers only?
• How were they selected?
• What were they asked?
• When were they surveyed?
• Were they merely order takers or did they manage client funds?
• How did the numbers correlate to market highs, lows, and turning points?
|
Traders were left to interpret the data which led to widely varying conclusions
Odd-Lot Short Sales
Another way to assess trader sentiment was to use the odd-lot short-sales (OLSS) data. This data was 100% objective and based on a clear, consistent, and quantitative approach. The logic was valid and formed on the idea that stock investors who traded odd-lots (i.e., less than 100 shares) were small traders with small accounts, and therefore unsophisticated and likely to be wrong about market lows and highs. Additionally, and of greatest importance, is the fact that small traders rarely sell short. Therefore, the odd-lot short seller has double jeopardy and should ipso facto be a good source of sentiment data. And that is correct! The larger the odd-lot short-sales number, the closer we are to a stock market low. The chart below shows the correlation.
But there are some problems
• OLSS is only available for stocks
• OLSS still does not address timing issues
• OLSS data is no longer a true reflection of small traders since advanced asset
allocation programs will take odd-lot positions to balance portfolios
Commitments of Traders Report (COT)
Every week the Commodity Futures Trading Commission (CFTC) releases the COT report which details net-long or short-position numbers and weekly changes for all US traded futures. There are three major categories: Large Speculators (LS), Commercials (C) and Small Speculators (SS).
The good news is:
• The data is fully objective
• It represents actual positions as opposed to opinions
• The history dates back to the 1980s and
• There are many subcategories designed to achieve better focus
|
But there are two serious drawbacks:
1. The COT is delayed by at least one week
2. The data is weekly, not daily
Consequently, the COT is not useful for short-term trading. On the other hand, the use of COT commercials data can be an outstanding tool for identifying major lows. I have already demonstrated this fact in numerous webinars.
Enter now The Daily Sentiment Index (DSI)
Given the above issues and limitations in assessing and implementing timely sentiment data, in 1987 I chose to reinvent a better wheel. With the help of a trader friend, I developed a daily procedure for conducting a small trader sentiment survey. The exact data collection methods have evolved significantly with the huge advances in internet communications. Since the data is very valuable to myself and others, I keep exact procedures confidential but I let the data speak for itself.
A Who's Who of World Class Traders, Hedge Funds, and Banks
Because the DSI has been a stellar tool for identifying and timing market turns, it has attracted users from across the globe. I have never aggressively advertised the DSI. 95% of DSI subscribers have come to me by referral and mentions in financial news and newsletters. The DSI subscriber list, if you could see it, would impress you inasmuch as it includes a good number of the biggest names in the business. WHY? Because they keep coming back year after year and since they send their friends, I can only assume that they find the DSI useful.
Let Me Show You My Tools for Using this Valuable Indicator!
On 13 May 2017, I will teach you in a 3-hour webinar, how to use the DSI as a stand-alone timing tool or indicator. as well as its use in conjunction with other indicators and strategies. Whereas I have previously taught DSI, this session will contain some heretofore secret uses which some of my professional DSI subscribers have willingly shared with me.
Here's what I will teach you:
• What is the DSI and how does it correlate with trends, tops and bottoms?
• What I have learned from 30 Years of DSI
• Clear examples of weekly, daily, and monthly sentiment signals
• How to use COT with DSI
• DSI, COT, and Cycles (Amazing!)
• DSI as a stand-alone trigger
• DSI as a filter for short-term market turns
• DSI as a seasonal filter
• Overbought/oversold conditions and DSI triggers
• DSI Divergence - a Powerful Tool for Big Moves
• NEW!!! DSI on Stock ETFs - the one year record
• Numerous Examples and Illustrations
• 3 Hours of Hugely Actionable Learning
|
Learn my BEST Tools for Using Sentiment in all Time Frames
With 30 years of daily small trader sentiment in my files, I have come to understand the obvious relationships between sentiment, panics, timing, highs, lows, and profits. I have also come to understand the inside secrets of market sentiment and timing. Let me teach them to you.
Register to attend.
If you have any questions, write me: jake@trade-futures.com
Truly,
Jake Bernstein
|