Problems viewing this email? View in your browser


Can you know your odds of success
and the ideal seasonal stock trends before they happen?

NEW 2017 eBook*

Jake Bernstein’s
Weekly Seasonal Stock Charts
2017 Edition

A Reference Work for Traders since 1978

Early Bird Price $129* (Reg $189)
SAVE $60
OFFER EXTENDED!
*Offer expires 10 June 2017


Order BOTH Books!
Weekly Seasonal Futures Charts 2017 Edition
Weekly Seasonal Stock Charts 2017 Edition

(eBook format electronic delivery) $378
$179*
SAVE $199
*Offer expires 10 June 2017


Scroll below
to order

*eBook format - electronic delivery


Dear Trader:

Since the 1970’s my Seasonal Futures Charts have been an industry standard as well as an indispensable tool to futures traders the world over.

These charts have provided valuable seasonal trend and probability information to short-term traders, speculators, hedgers and position traders.

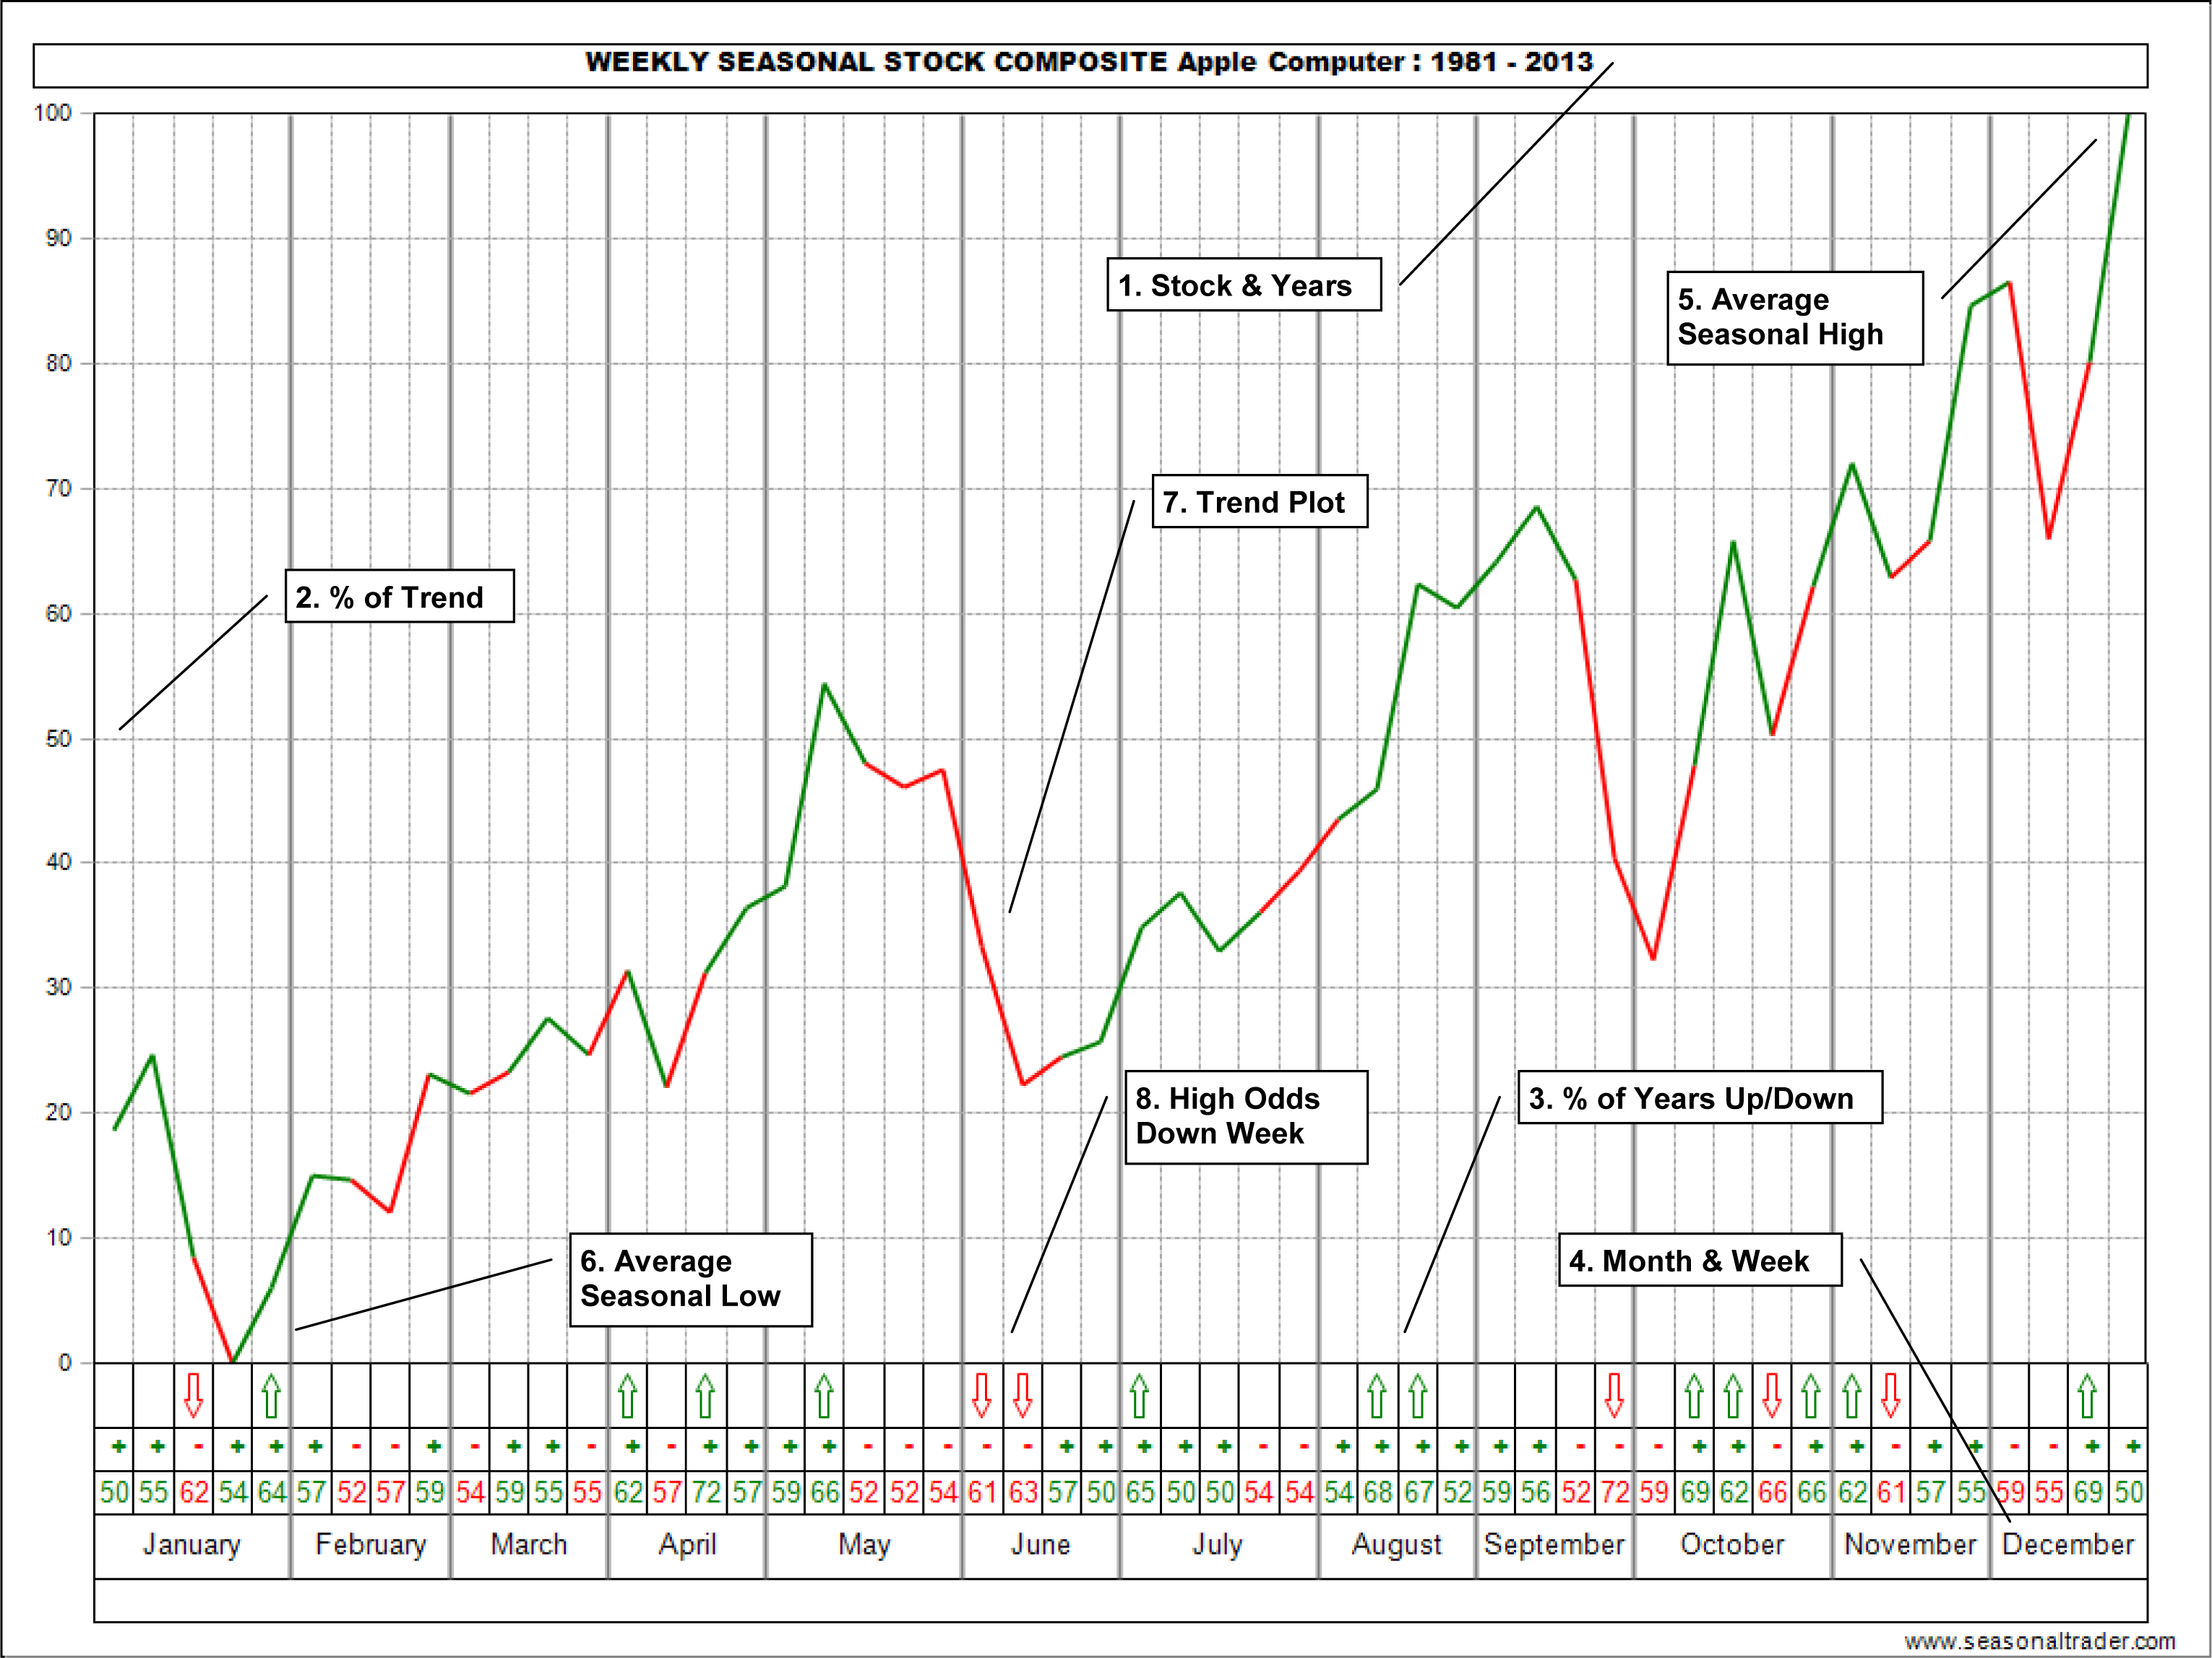
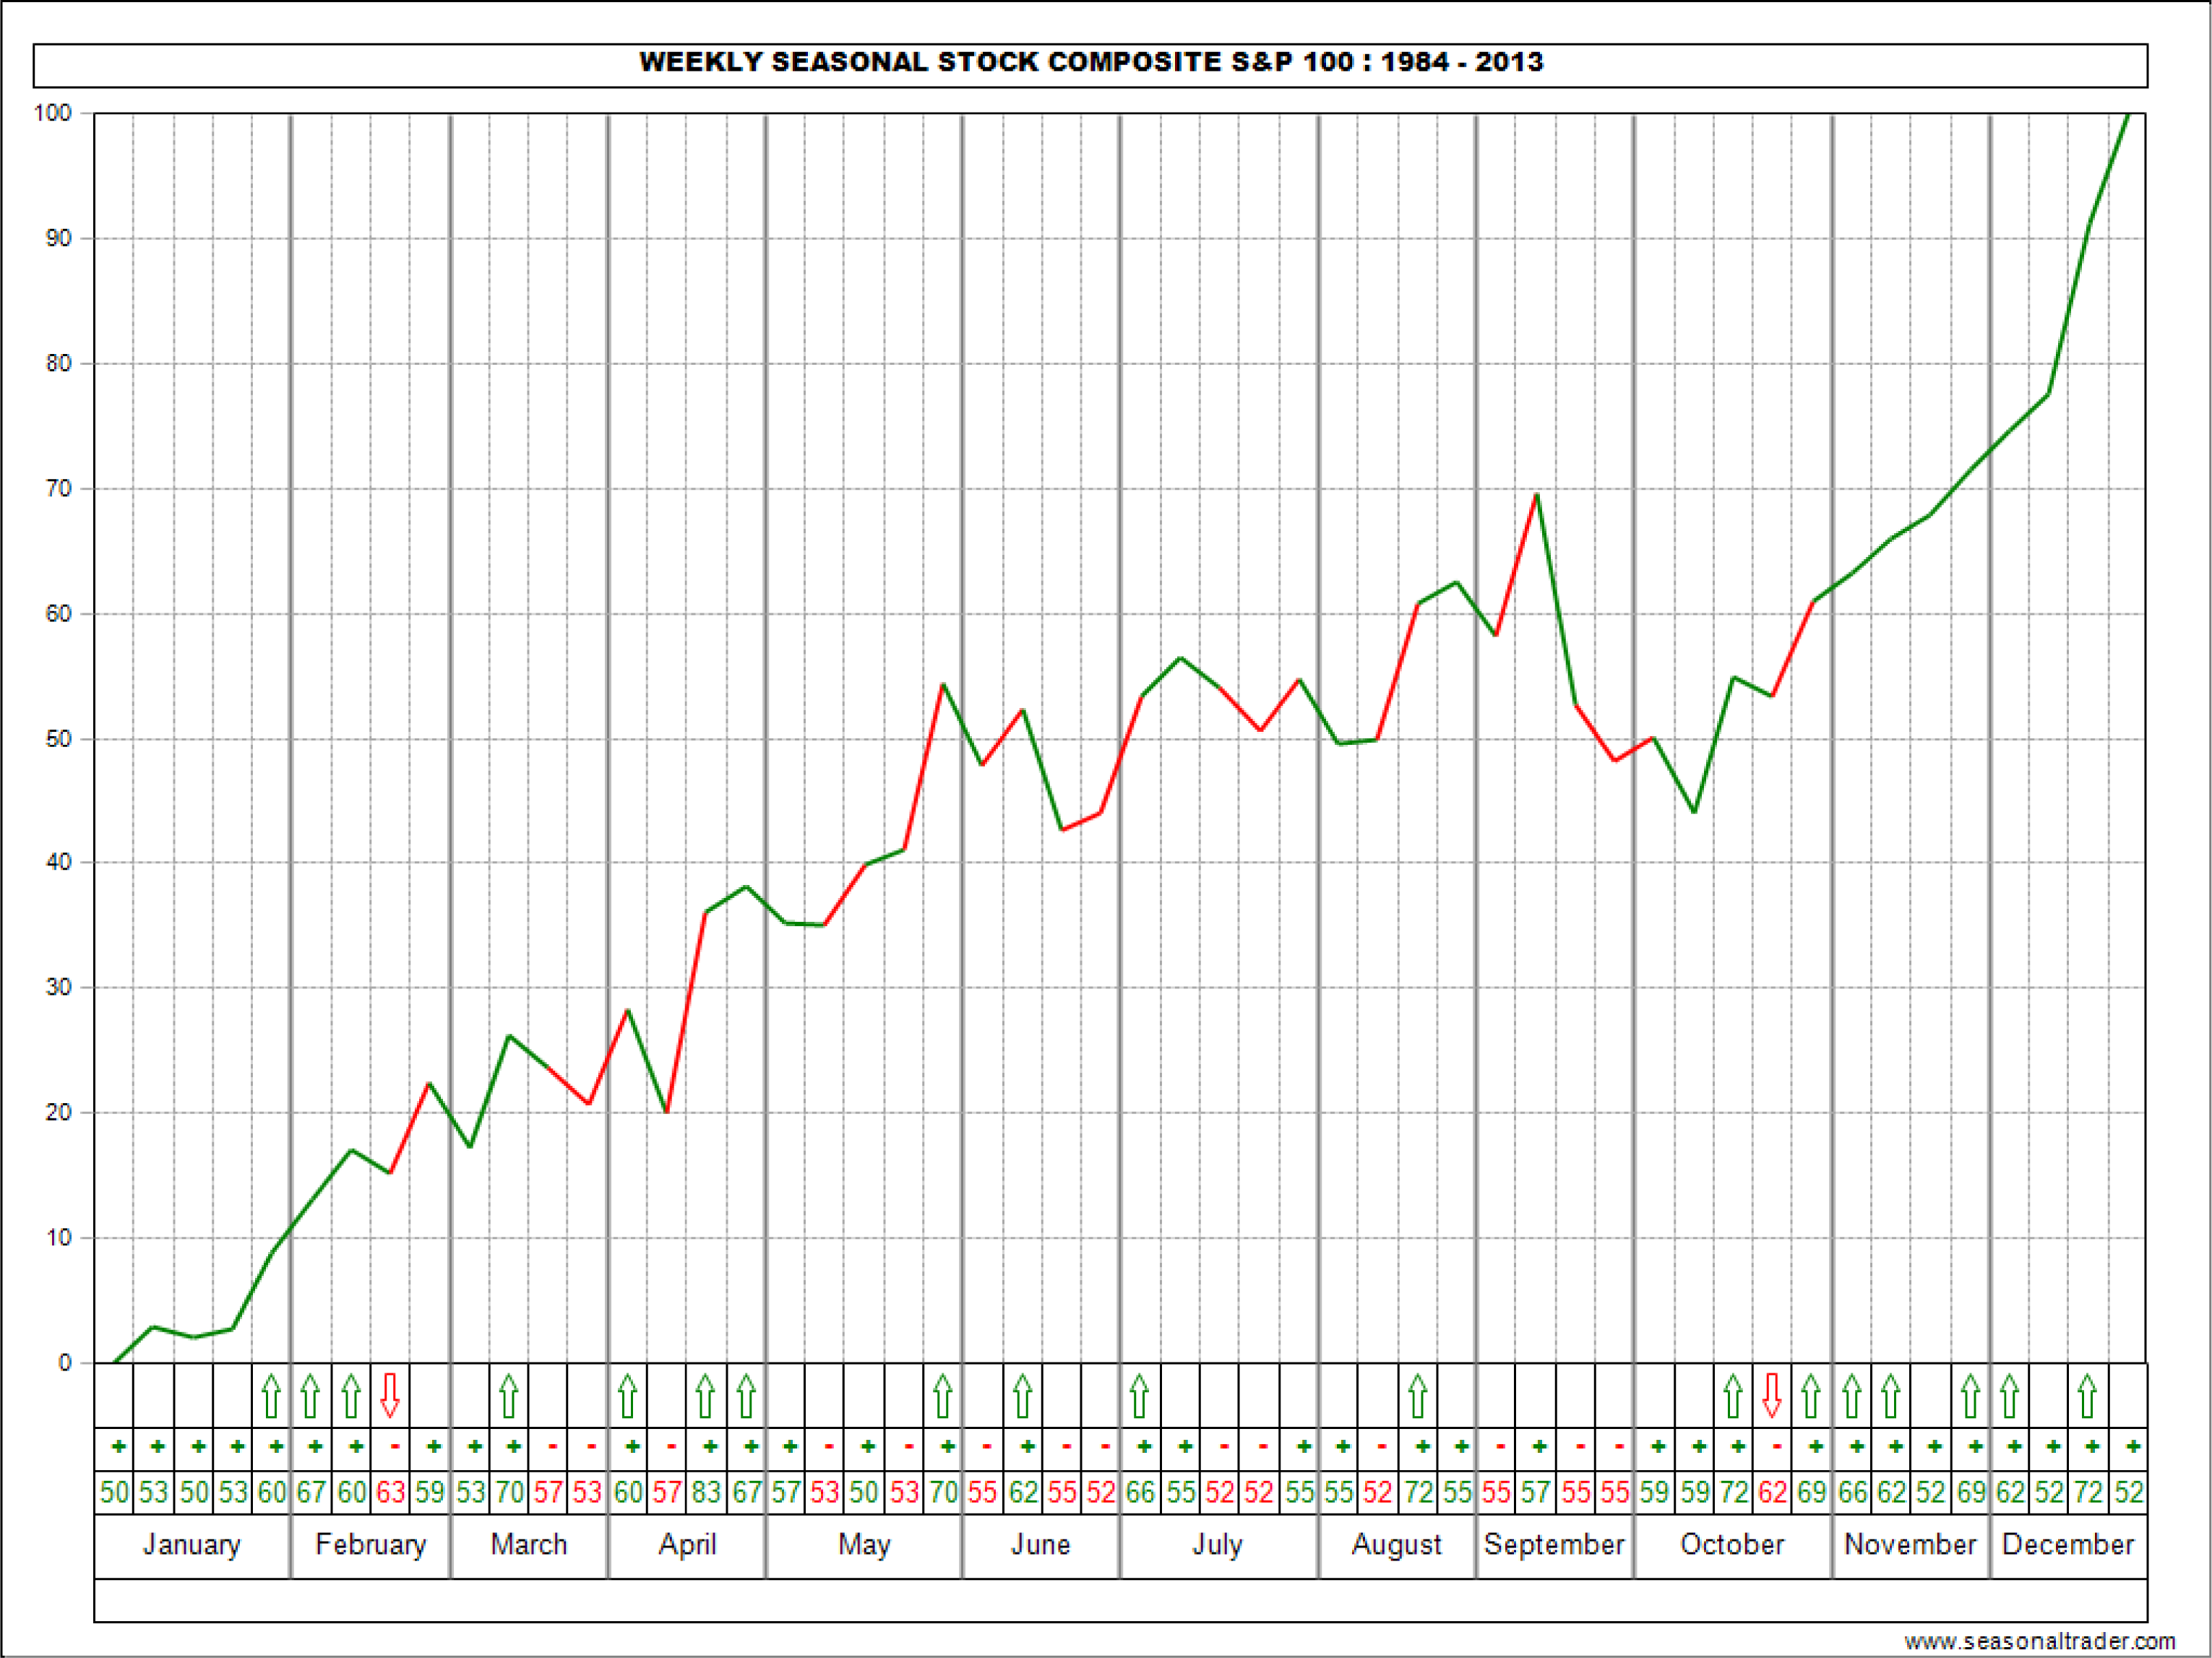
At a glance they reveal the % of time up or down for the typical week, as well as normalized size of move and average seasonal top or bottom on selected US stocks. Now for the first time ever my weekly seasonal charts for over 90 major stocks are available in ebook format.

Here is your opportunity to get the ALL NEW 2017 Edition of this outstanding reference work containing over 100 pages (electronic format) with clear, concise explanatory details on what these amazing charts contain, how they were constructed, what they mean and how to use them to your decisive advantage! See the sample charts below.

(Click on the charts below for a larger view)

Weekly Seasonal Stock Composite - APPLE

Ending year on NEW 2017 Edition will be updated to reflect all data.


Weekly Seasonal Stock Composite - S&P

Know your odds and the ideal trend before they happen!
NEW! Weekly Seasonal Stock Charts 2017 Edition
  • 93 charts by market and contract month showing average weekly seasonal trend

  • 105 pages of solid actionable information

  • Charts show % of time market has closed UP or DOWN from last weekly close

  • Identifies HIGH odds weeks

  • Identifies HIGHEST odds up and down moves

  • See the entire year at a glance

  • Complete with detailed instructions for use

  • Includes tips and strategies for getting the greatest profit advantage from
    the seasonal trends

  • Shows usual week of seasonal HIGH and LOW for each stock

  • Shows relative size of up and down moves

  • Covers over 110 years of market history on the Dow Jones Average

  • Helps you find and trade the BEST short-term and intermediate-term seasonal moves

Truly,

Share:

fb tw in

email: jake@trade-futures.com


To order
Jake Bernstein's
Weekly Seasonal Stock Charts | 2017 Edition

choose the appropriate link below,
or call the office: Ph 831-430-0600, 800-678-5253

Email delivery within 48 hours.

Weekly Seasonal Stock Charts 2017 Edition
(eBook format electronic delivery): $189
$129*
SAVE $60

Click here to order

* Offer expires 10 JUNE 2017


Order BOTH Books!

Weekly Seasonal Futures Charts 2017 Edition
Weekly Seasonal Stock Charts 2017 Edition

(eBook format electronic delivery): $378
$179
SAVE $199

Click here to order

* Offer expires 10 JUNE 2017


Network Press | 831-430-0600 | 800-678-5253